Featured
Research topics

Court reporter shortage
Despite retention and recruitment incentives, courts across California are experiencing increasing attrition and difficulty recruiting court reporters.

Judicial Officer demographics
Demographic data on gender, race/ethnicity, sexual orientation, gender identity, and veteran and disability status of California State justices and judges.

Court workload analysis
Assessment of court workload and the need for judgeships, using uniform criteria and established workload methodologies.

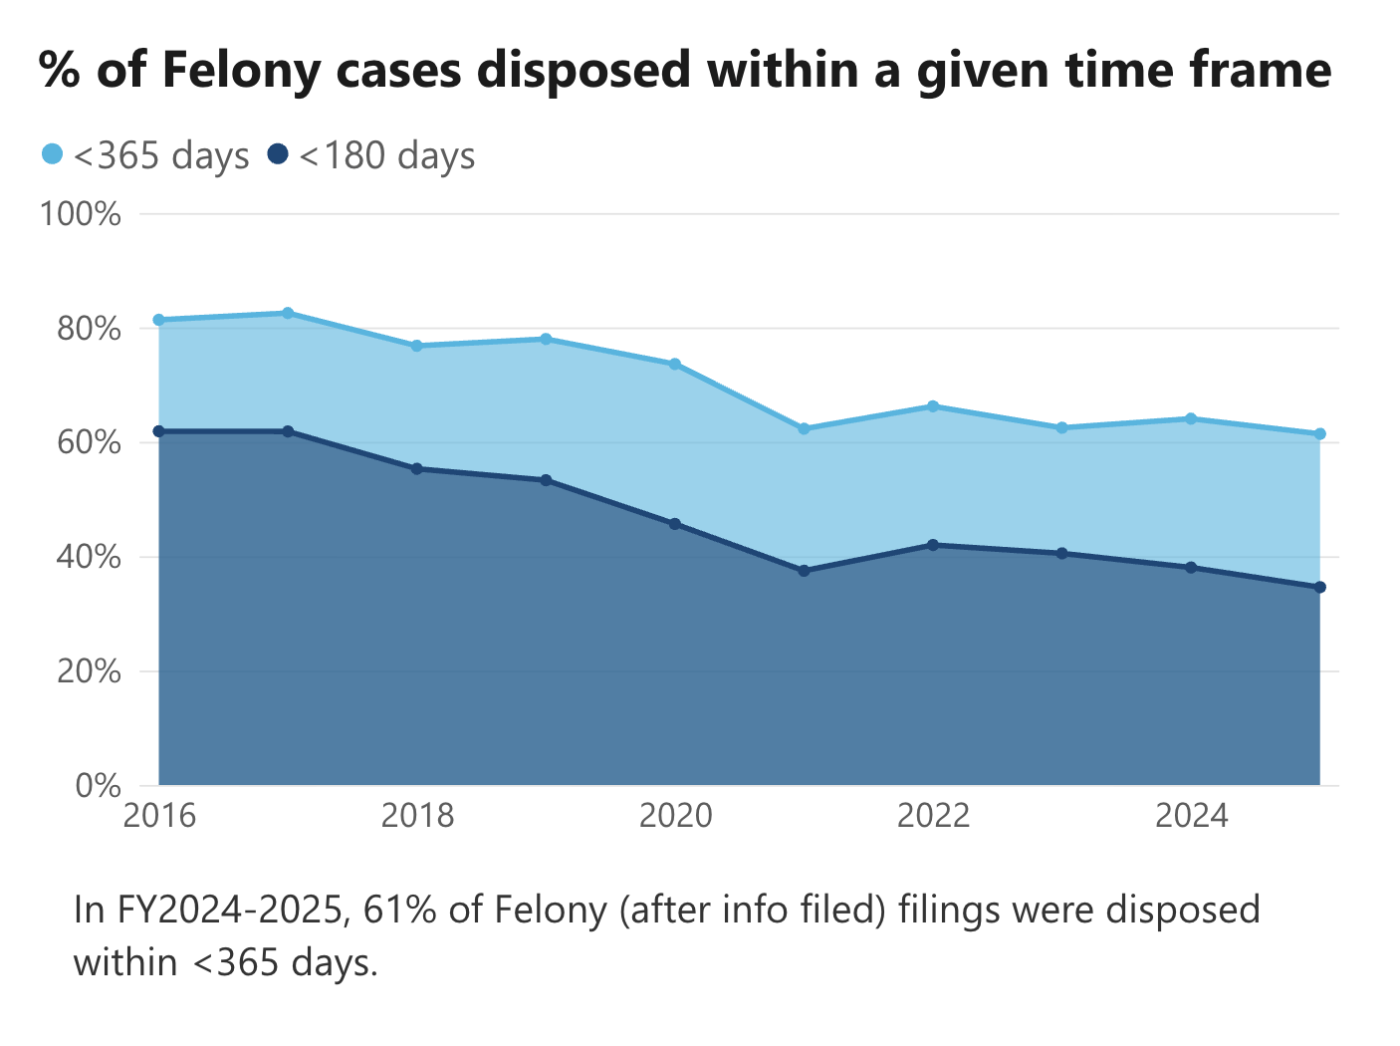
Filings and dispositions statistics
10-year caseload and trend data by county.

Court employee statistics
Numbers of Justices, Subordinate Judicial Officers, and Full time employees for the courts.

CARE Act Implementation
Summary of petitions, hearings, and outcomes for the Community Assistance, Recovery, and Empowerment (CARE) Act.
COURT FACT
There are 6.4 million people with limited English skills. In 2022, 1,820 court interpreters provided more than 673,000 interpretations in 16 certified languages, including American Sign Language.